EchoStar Corporation's Financial Performance Analysis
Font: Financial Modeling Prep • Mar 02, 2026
- EchoStar Corporation (NASDAQ:SATS) reported an EPS of -$4.27 for March 2, 2026, significantly below estimates.
- The company generated revenue of approximately $3.8 billion, slightly exceeding the estimated $3.79 billion.
- EchoStar's financial ratios indicate negative earnings and potential liquidity challenges, with a P/E ratio of -2.59 and a current ratio of 0.42.
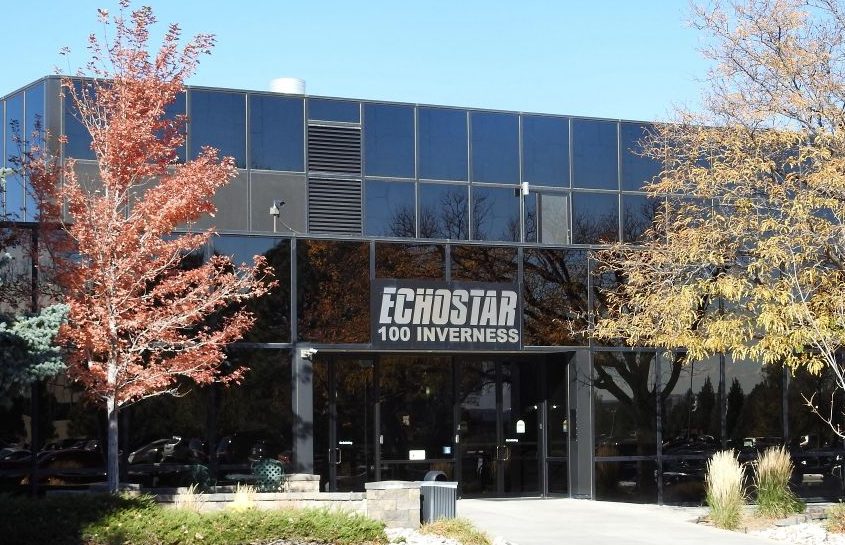
EchoStar Corporation, trading as (NASDAQ:SATS), operates in the satellite and communication industry. The company recently reported an earnings per share (EPS) of -$4.27 for March 2, 2026, which was significantly below the estimated EPS of -$0.64. Despite this, EchoStar generated a revenue of approximately $3.8 billion, slightly exceeding the estimated $3.79 billion.
In the recent quarter, SATS reported a loss of $1.03 per share, which was larger than the Zacks Consensus Estimate of a $0.85 loss. This represents a significant decline from the $1.24 per share earnings reported in the same quarter last year. The earnings surprise was -21.89%, highlighting the company's struggle to meet expectations.
EchoStar's revenue for the quarter ending December 2025 was $3.8 billion, surpassing the Zacks Consensus Estimate by 1.42%. However, this was a slight decrease from the $3.97 billion reported in the same period the previous year. Despite the revenue beat, the company experienced a substantial net loss of $14.5 billion in 2025, primarily due to non-cash asset impairments and other expenses totaling approximately $17.63 billion.
The company's financial ratios reflect its current challenges. With a price-to-earnings (P/E) ratio of -2.59 and an earnings yield of -38.54%, EchoStar is experiencing negative earnings. The debt-to-equity ratio is notably high at 9.53, indicating a significant reliance on debt financing. Additionally, the current ratio of 0.42 suggests potential liquidity challenges in meeting short-term obligations.
Market Overview
|
WETO
Wetour Robotics Limited
|
$0.09
200.00%
|
|
LBGJ
Li Bang International Corporation Inc. Ordinary Shares
|
$0.02
3.89%
|
|
MGRX
Mangoceuticals, Inc.
|
$0.56
89.75%
|
|
ZBAO
Zhibao Technology Inc. Class A Ordinary Shares
|
$0.20
16.00%
|
|
ONFO
Onfolio Holdings, Inc.
|
$0.08
-6.18%
|
|
KWM
K Wave Media Ltd.
|
$0.08
11.01%
|
|
FMFC
Kandal M Venture Limited
|
$0.52
141.41%
|
|
CYCU
Cycurion, Inc. Common Stock
|
$0.89
-44.84%
|
|
NVDA
NVIDIA Corporation
|
$200.75
2.93%
|
|
AAPL
Apple Inc.
|
$308.91
-7.35%
|