Ciena Corporation (NYSE:CIEN) Earnings Preview: A Look at Upcoming Financial Performance
Font: Financial Modeling Prep • Mar 04, 2026

- Ciena Corporation (NYSE:CIEN) is set to release its quarterly earnings with an expected EPS of $1.14 and revenue of $1.4 billion.
- The company has a history of surpassing earnings estimates, with an average earnings surprise of 23.51% over the past two quarters.
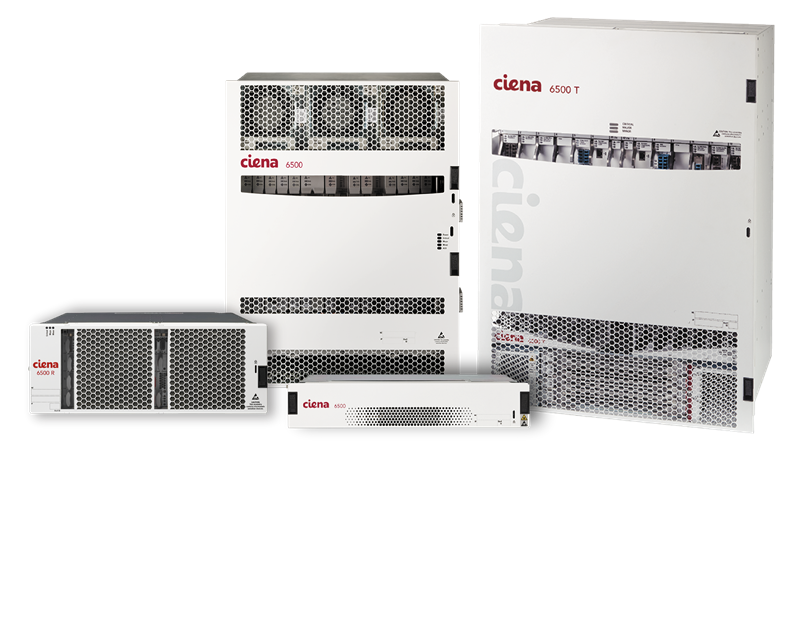
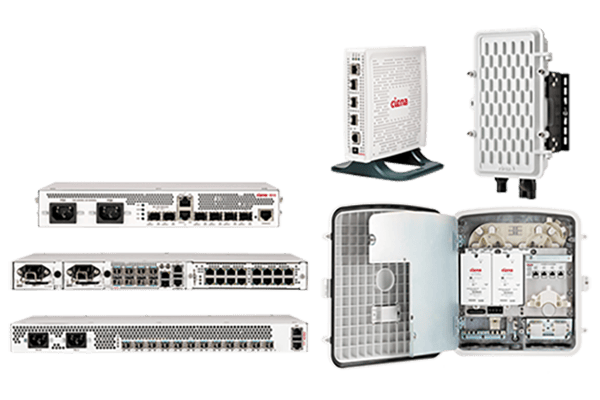
Ciena Corporation (NYSE:CIEN) is a prominent player in the telecommunications equipment industry, specializing in providing network solutions that enhance the performance of communication networks. As a leader in the Zacks Communication - Components industry, Ciena is known for its innovative products and services that cater to the growing demand for bandwidth and cloud investments. The company faces competition from other industry giants but has consistently demonstrated its ability to outperform market expectations.
CIEN is set to release its quarterly earnings on March 5, 2026, with Wall Street estimating earnings per share (EPS) of $1.14 and revenue of approximately $1.4 billion. Historically, Ciena has a strong track record of surpassing earnings estimates, with an average earnings surprise of 23.51% over the past two quarters. In the most recent quarter, Ciena reported earnings of $0.91 per share, significantly outperforming the Zacks Consensus Estimate of $0.77 per share, resulting in an 18.18% surprise.
Ciena's management has guided first-quarter revenue to be between $1.35 billion and $1.43 billion, with a consensus estimate of $1.39 billion, reflecting a 29.9% increase compared to the previous year. The company expects to maintain steady gross margins in the range of 43% to 44%. Despite these optimistic projections, the current model does not predict an earnings beat for Ciena this time around.
The company's enterprise value to sales ratio is around 10.33, reflecting the market's valuation of the company's total value relative to its sales. Ciena maintains a strong liquidity position with a current ratio of approximately 2.73, indicating it has more than twice the current assets needed to cover its current liabilities.
Market Overview
|
SOXS
Direxion Daily Semiconductor Bear 3X ETF
|
$5.20
5.91%
|
|
CXAI
CXApp Inc.
|
$0.26
60.36%
|
|
YYGH
YY Group Holding Limited
|
$0.16
10.28%
|
|
SBEV
Splash Beverage Group, Inc.
|
$0.33
38.22%
|
|
BITO
ProShares - Bitcoin ETF
|
$8.65
-2.81%
|
|
TZA
Direxion Daily Small Cap Bear 3X ETF
|
$4.25
-4.06%
|
|
NVDA
NVIDIA Corporation
|
$218.66
1.82%
|
|
ZCMD
Zhongchao Inc.
|
$0.04
-32.96%
|
|
BURU
Nuburu, Inc.
|
$0.17
-7.66%
|
|
HUBC
HUB Cyber Security Ltd.
|
$0.20
-68.90%
|