Ollie's Bargain Outlet (NASDAQ: OLLI) Q1 2026 Earnings: Growth Despite Revenue Miss
Font: Financial Modeling Prep • Jun 03, 2026
- Ollie's Bargain Outlet exceeded analyst earnings per share estimates for Q1 fiscal 2026, demonstrating strong profitability in the discount retail sector.
- Despite a slight revenue miss, the closeout retailer achieved a 14% increase in net sales year-over-year, primarily driven by strategic new store openings.
- The company successfully navigated a challenging consumer backdrop, including rising gas prices and reduced customer traffic, showcasing resilience in its financial performance.
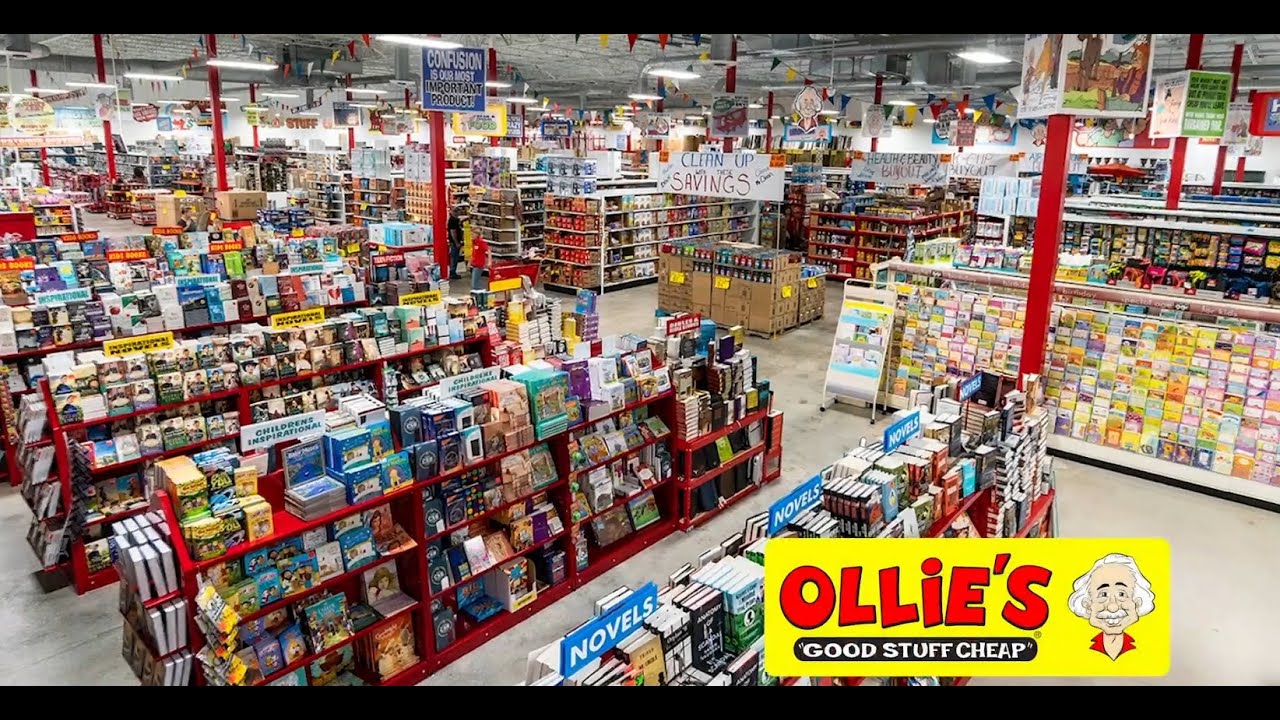
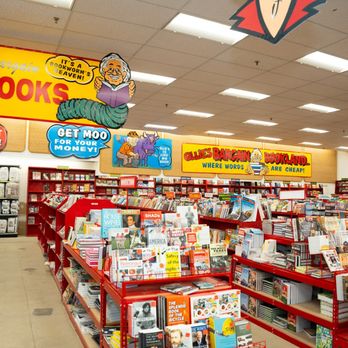
Ollie's Bargain Outlet (NASDAQ: OLLI) is a prominent closeout retailer that offers a variety of brand-name products at discounted prices. The company operates a chain of stores across the United States. It recently announced its financial results for the first quarter of fiscal 2026, which show strong earnings growth despite slightly missing revenue expectations.
On June 3, 2026, Ollie's Bargain Outlet announced quarterly earnings of $0.91 per share, surpassing analyst estimates of $0.87. As highlighted by Zacks, this performance is a notable improvement from the $0.75 per share earned in the same quarter of the previous year. The company is now raising its earnings per share outlook for the 2026 fiscal year, signaling confidence in its future financial performance.
The company's reported revenue was $658.93 million, which fell just short of the consensus estimate of $661.65 million. However, this figure still represents a 14% increase in net sales from the prior year. According to management, this top-line growth is mainly due to the opening of new store locations, contributing to its market expansion.
This performance occurred during what the company's CEO describes as a "challenging consumer backdrop." A rapid spike in gas prices led to fewer customer trips, which impacted traffic. This trend particularly affected sales in categories like lawn and garden and had a greater impact on stores in rural and suburban areas, highlighting the impact of consumer spending trends on the retail sector.
Ollie's Bargain Outlet's financial health includes a Debt-to-Equity ratio of 0.36, which indicates the company has less debt compared to its shareholder equity. Its current ratio of 2.41 suggests it has ample short-term assets to cover its short-term debts, reflecting strong liquidity. The company's Price-to-Earnings (P/E) ratio, which compares its share price to its earnings, is 20.66, offering an investment insight into its valuation.
Market Overview
|
SDST
Stardust Power Inc.
|
$0.03
-35.16%
|
|
WFF
WF Holding Limited
|
$0.18
-91.75%
|
|
TGL
Treasure Global Inc.
|
$0.45
61.87%
|
|
NIVF
NewGenIvf Group Limited
|
$0.29
50.20%
|
|
GLND
Greenland Energy Company Common Stock
|
$3.90
76.47%
|
|
YRD
Yiren Digital Ltd.
|
$0.65
42.77%
|
|
BAC
Bank of America Corporation
|
$51.39
-4.76%
|
|
NVDA
NVIDIA Corporation
|
$221.30
-3.16%
|
|
CRWV
CoreWeave, Inc. Class A Common Stock
|
$65.78
-15.46%
|
|
INTC
Intel Corp.
|
$98.12
-4.56%
|