Casey's General Stores (NASDAQ: CASY) Reports Robust Quarterly Performance Driven by Prepared Food Sales
Font: Financial Modeling Prep • Jun 10, 2026

- Casey's General Stores' business model, particularly its prepared food offerings, is a primary catalyst for its strong financial results.
- The company announced impressive quarterly figures, with revenue reaching $4.57 billion and earnings per share (EPS) at $4.37, both significantly surpassing analyst expectations.
- Key financial health indicators include a trailing price-to-earnings (P/E) ratio of 39.36, a price-to-sales (P/S) ratio of 1.61, a debt-to-equity ratio of 0.84, and a current ratio of 1.01.
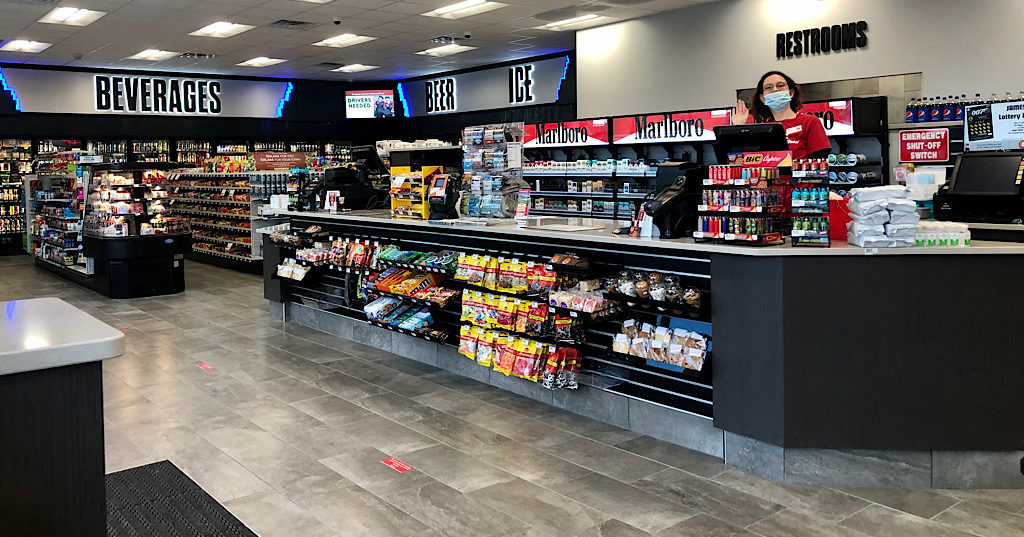
Casey's General Stores (NASDAQ: CASY) is a prominent chain of convenience stores based in Ankeny, Iowa. The company's business model focuses heavily on its prepared food offerings, which are a major driver of its financial results and overall financial performance. As highlighted by WSJ, strong sales in items like whole pizzas and nonalcoholic beverages contribute significantly to its performance, making it a notable player in the convenience store stock market.
On June 9, 2026, Casey's General Stores' latest quarterly report showcased strong revenue growth figures. The company reported revenue of $4.57 billion, which is a 14.5% increase over the same period last year. This impressive result surpasses the consensus estimate of $4.33 billion and marks a positive surprise of over 4%, as highlighted by Zacks, indicating a strong quarter for retail earnings.
The report also detailed a significant EPS beat on profitability. Casey's General Stores posted an earnings per share (EPS) of $4.37. EPS is a crucial measure of a company's profit for each share of its stock. This figure is well above the analyst consensus estimate of $3.36 and shows major growth from the $2.63 reported a year ago, underscoring robust profitability.
Looking at its stock valuation, Casey's General Stores has a trailing price-to-earnings (P/E) ratio of 39.36. This metric shows how much investors are willing to pay for each dollar of the company's earnings, offering insight into its market perception. The company also has a price-to-sales (P/S) ratio of 1.61, which compares its stock price to its revenues, providing another angle for investment analysis.
The company's financial structure includes a debt-to-equity ratio of 0.84, which compares its total debt to its shareholder equity. In terms of liquidity, its current ratio is 1.01. This suggests its current assets are just sufficient to meet its current liabilities, offering a view of its short-term financial health and operational efficiency.
Market Overview
|
SOXS
Direxion Daily Semiconductor Bear 3X ETF
|
$3.25
-12.52%
|
|
BIYA
Baiya International Group Inc.
|
$0.55
95.82%
|
|
YHC
LQR House Inc.
|
$0.08
-91.51%
|
|
EDBL
Edible Garden AG Incorporated
|
$0.19
13.65%
|
|
INLF
INLIF Limited
|
$0.06
-12.88%
|
|
TZA
Direxion Daily Small Cap Bear 3X ETF
|
$3.79
-1.56%
|
|
BITO
ProShares Bitcoin ETF
|
$7.98
-2.56%
|
|
CELZ
Creative Medical Technology Holdings, Inc.
|
$1.45
78.97%
|
|
NVDA
NVIDIA Corporation
|
$200.09
2.63%
|
|
AAL
American Airlines Group Inc.
|
$18.07
0.84%
|