Dave & Buster's Entertainment (NASDAQ: PLAY) Q1 2026 Earnings Preview: Revenue Growth and Profitability Concerns
Font: Financial Modeling Prep • Jun 12, 2026

- Dave & Buster's Entertainment is scheduled to release its Q1 2026 financial results on June 15, 2026, followed by a management conference call to discuss quarterly performance.
- Wall Street analysts project Q1 2026 revenue to be around $580.60 million, indicating a modest 0.6% year-over-year increase.
- Profitability concerns loom with an anticipated significant decline in earnings per share (EPS), potentially reaching $0.37, reflecting recent downward adjustments.
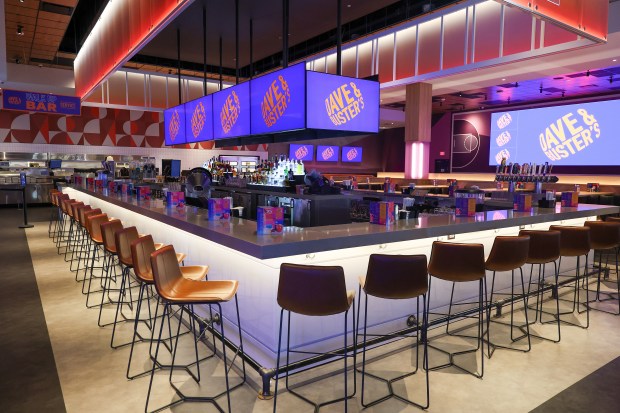
Dave & Buster's Entertainment, Inc. (NASDAQ: PLAY) operates a chain of entertainment and dining venues. The company is set to release its first-quarter 2026 financial results on Monday, June 15, 2026, after the market closes. This announcement, as reported by GlobeNewswire, will be followed by a management conference call to discuss the quarterly performance and investor outlook.
Ahead of the report, Wall Street analysts have a consensus revenue estimate of approximately $580.60 million for Dave & Buster's Entertainment. Other projections, as highlighted by Zacks Investment Research, anticipate revenues around $571.09 million. This figure would represent a small 0.6% increase compared to the same quarter in the previous year, indicating modest revenue growth.
Regarding profitability, the general analyst consensus for earnings per share (EPS) is $0.65. However, some forecasts suggest a much lower EPS of $0.37. This would mark a significant 51.3% decline from the prior year. This lower expectation reflects a recent 20.8% downward adjustment by analysts over the past 30 days, highlighting potential challenges in Dave & Buster's Entertainment's stock performance.
Looking at the company's financial structure, its debt-to-equity ratio is 34.71. This high ratio suggests the company uses a significant amount of debt to finance its operations. Furthermore, its current ratio stands at 0.29, meaning its short-term liabilities are greater than its short-term assets, which can indicate a liquidity risk for Dave & Buster's Entertainment.
Market Overview
|
NCT
Intercont (Cayman) Limited Ordinary shares
|
$0.50
66.83%
|
|
UZX
Linkage Global Inc. Class A Ordinary Shares
|
$0.10
5.81%
|
|
SOAR
Volato Group, Inc.
|
$0.22
15.30%
|
|
NVDA
NVIDIA Corporation
|
$210.96
-3.36%
|
|
NOK
Nokia Oyj
|
$9.66
-13.25%
|
|
FTFT
Future FinTech Group Inc.
|
$8.04
179.17%
|
|
ADBT
Advasa Holdings Inc.
|
$0.10
-58.24%
|
|
SOXL
Direxion Daily Semiconductor Bull 3X ETF
|
$101.13
-16.98%
|
|
INTC
Intel Corp.
|
$97.19
-5.59%
|
|
CTNT
Cheetah Net Supply Chain Service Inc.
|
$0.15
-86.95%
|