Southwest Airlines (NYSE: LUV) Q2 Earnings: Strong EPS, Revenue Miss, and Cautious Outlook for the Airline Stock
Font: Financial Modeling Prep • Jul 22, 2026
- Strong EPS Beat: Southwest Airlines reported an EPS of $0.94, significantly exceeding analyst estimates of $0.51.
- Revenue Shortfall Amidst Record Operating Revenues: Despite a quarterly revenue of $8.43 billion falling short of expectations, the airline achieved record operating revenues.
- Mixed Guidance: While the Q3 adjusted earnings forecast ($0.50 to $0.75) is cautious, the full-year outlook for adjusted earnings ($3.25 to $4.25) is stronger.
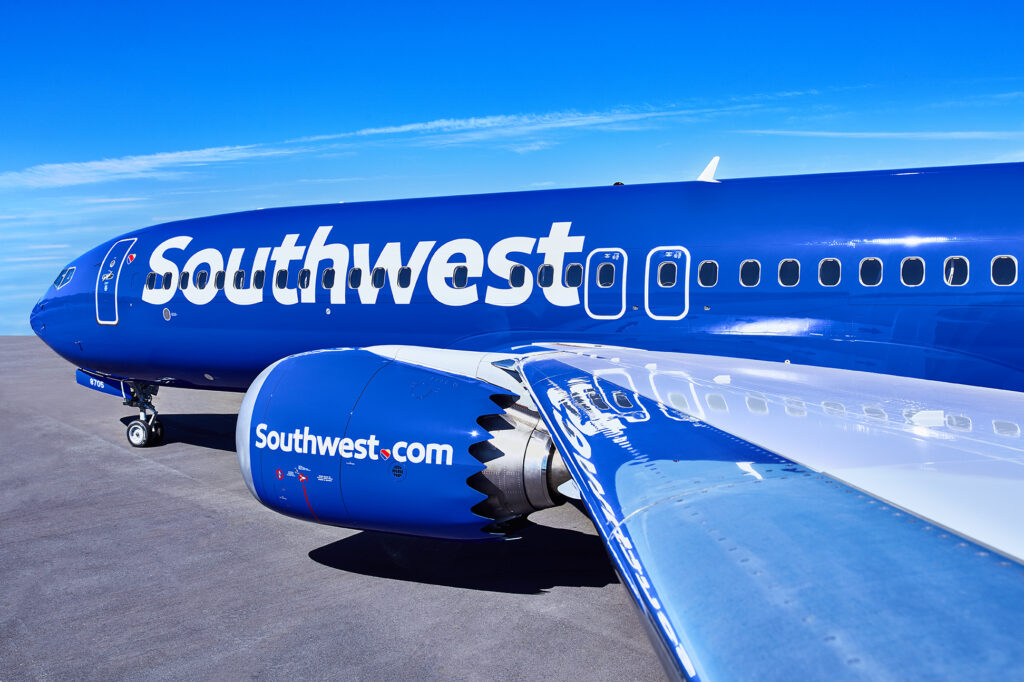
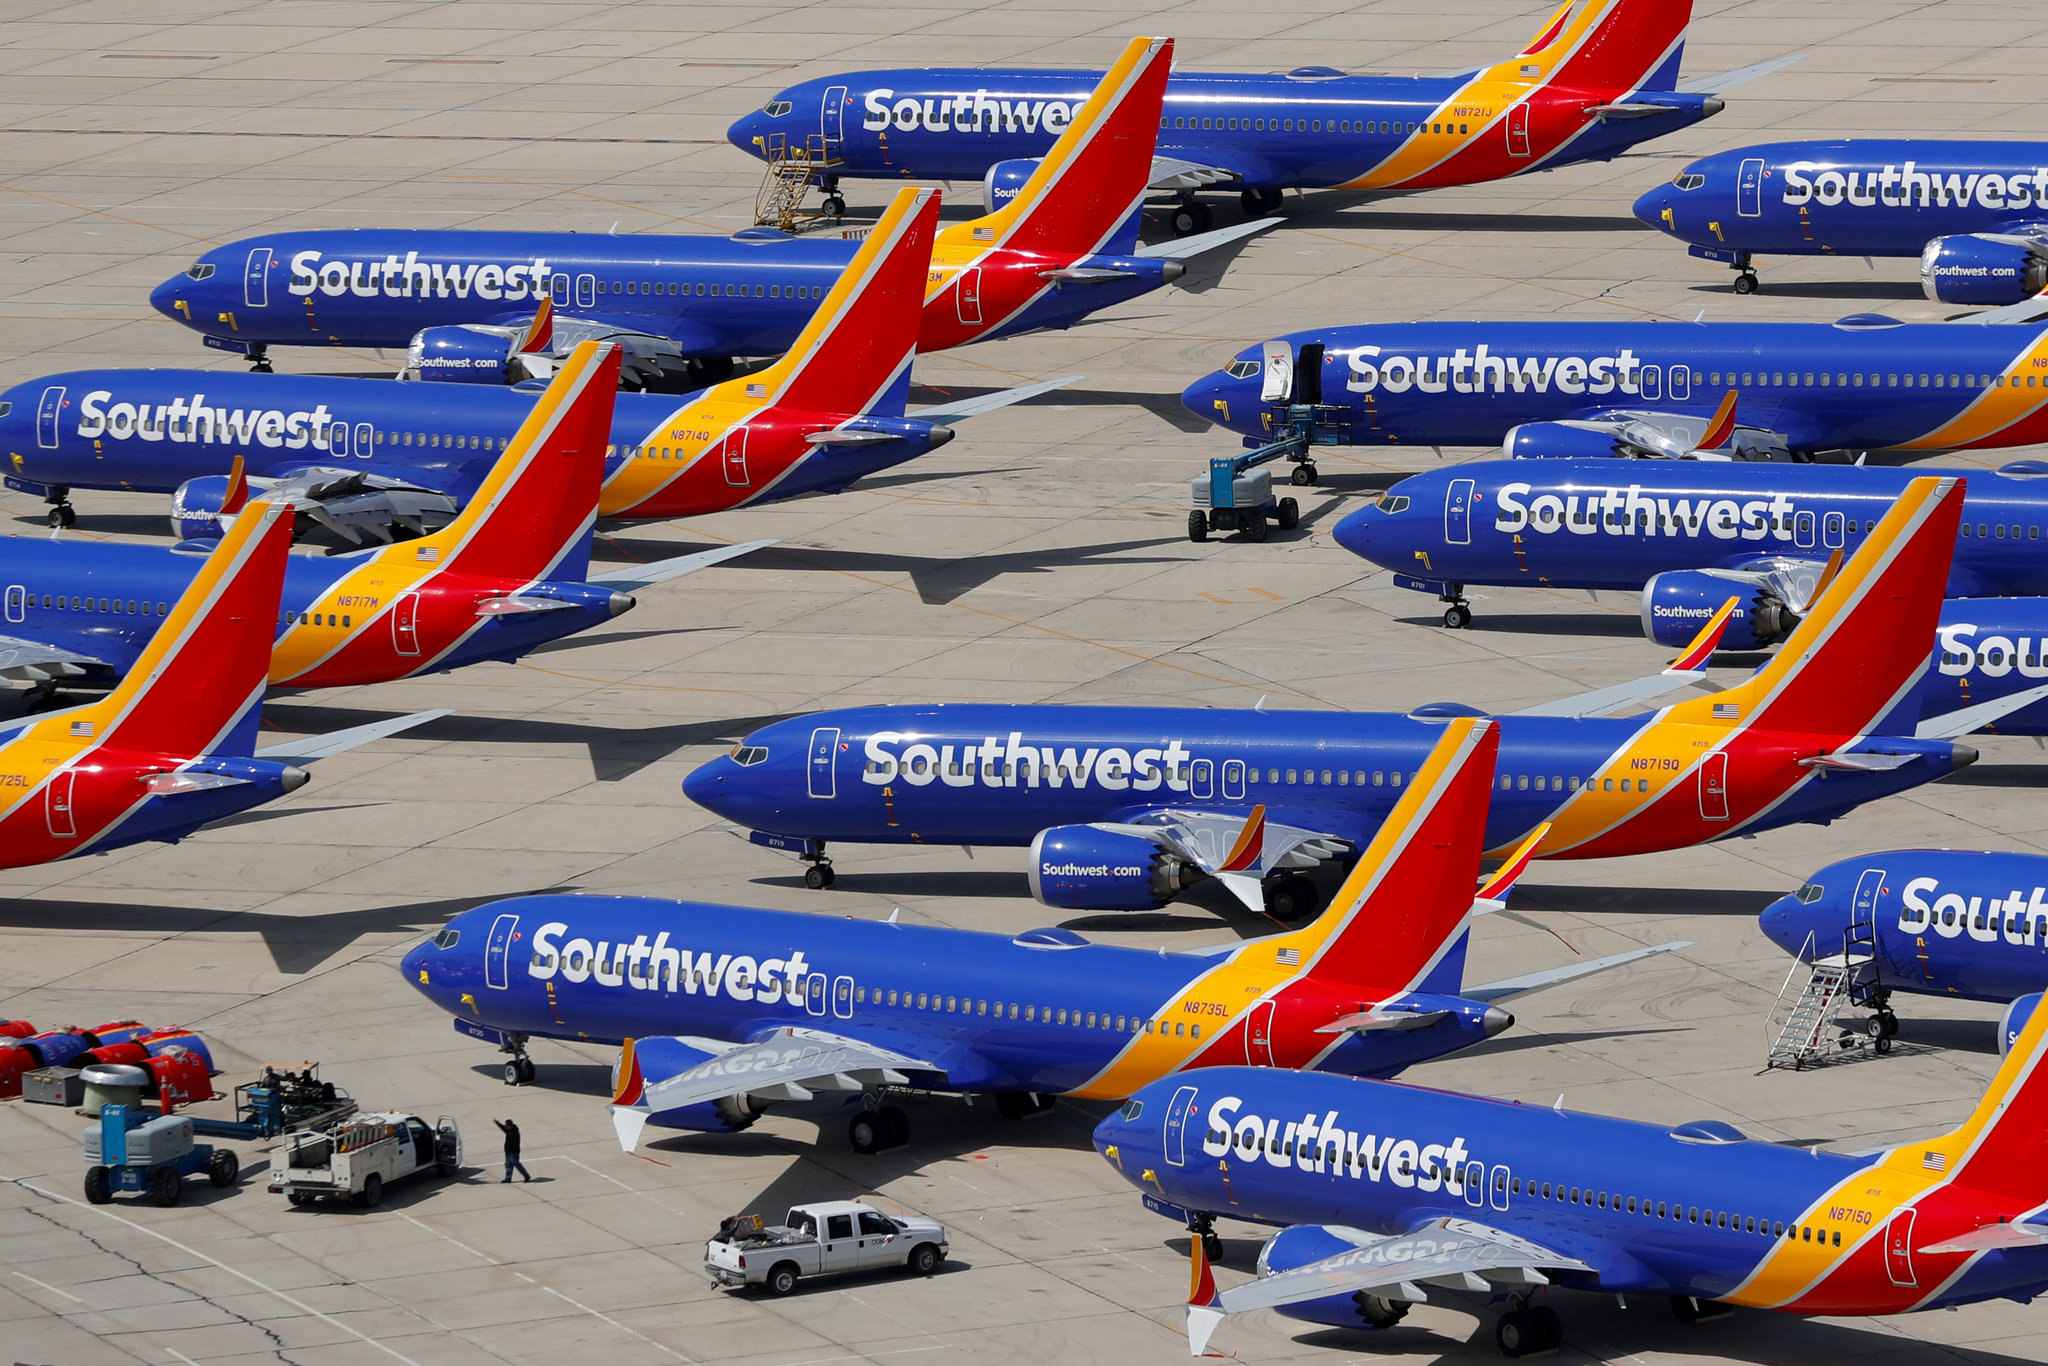
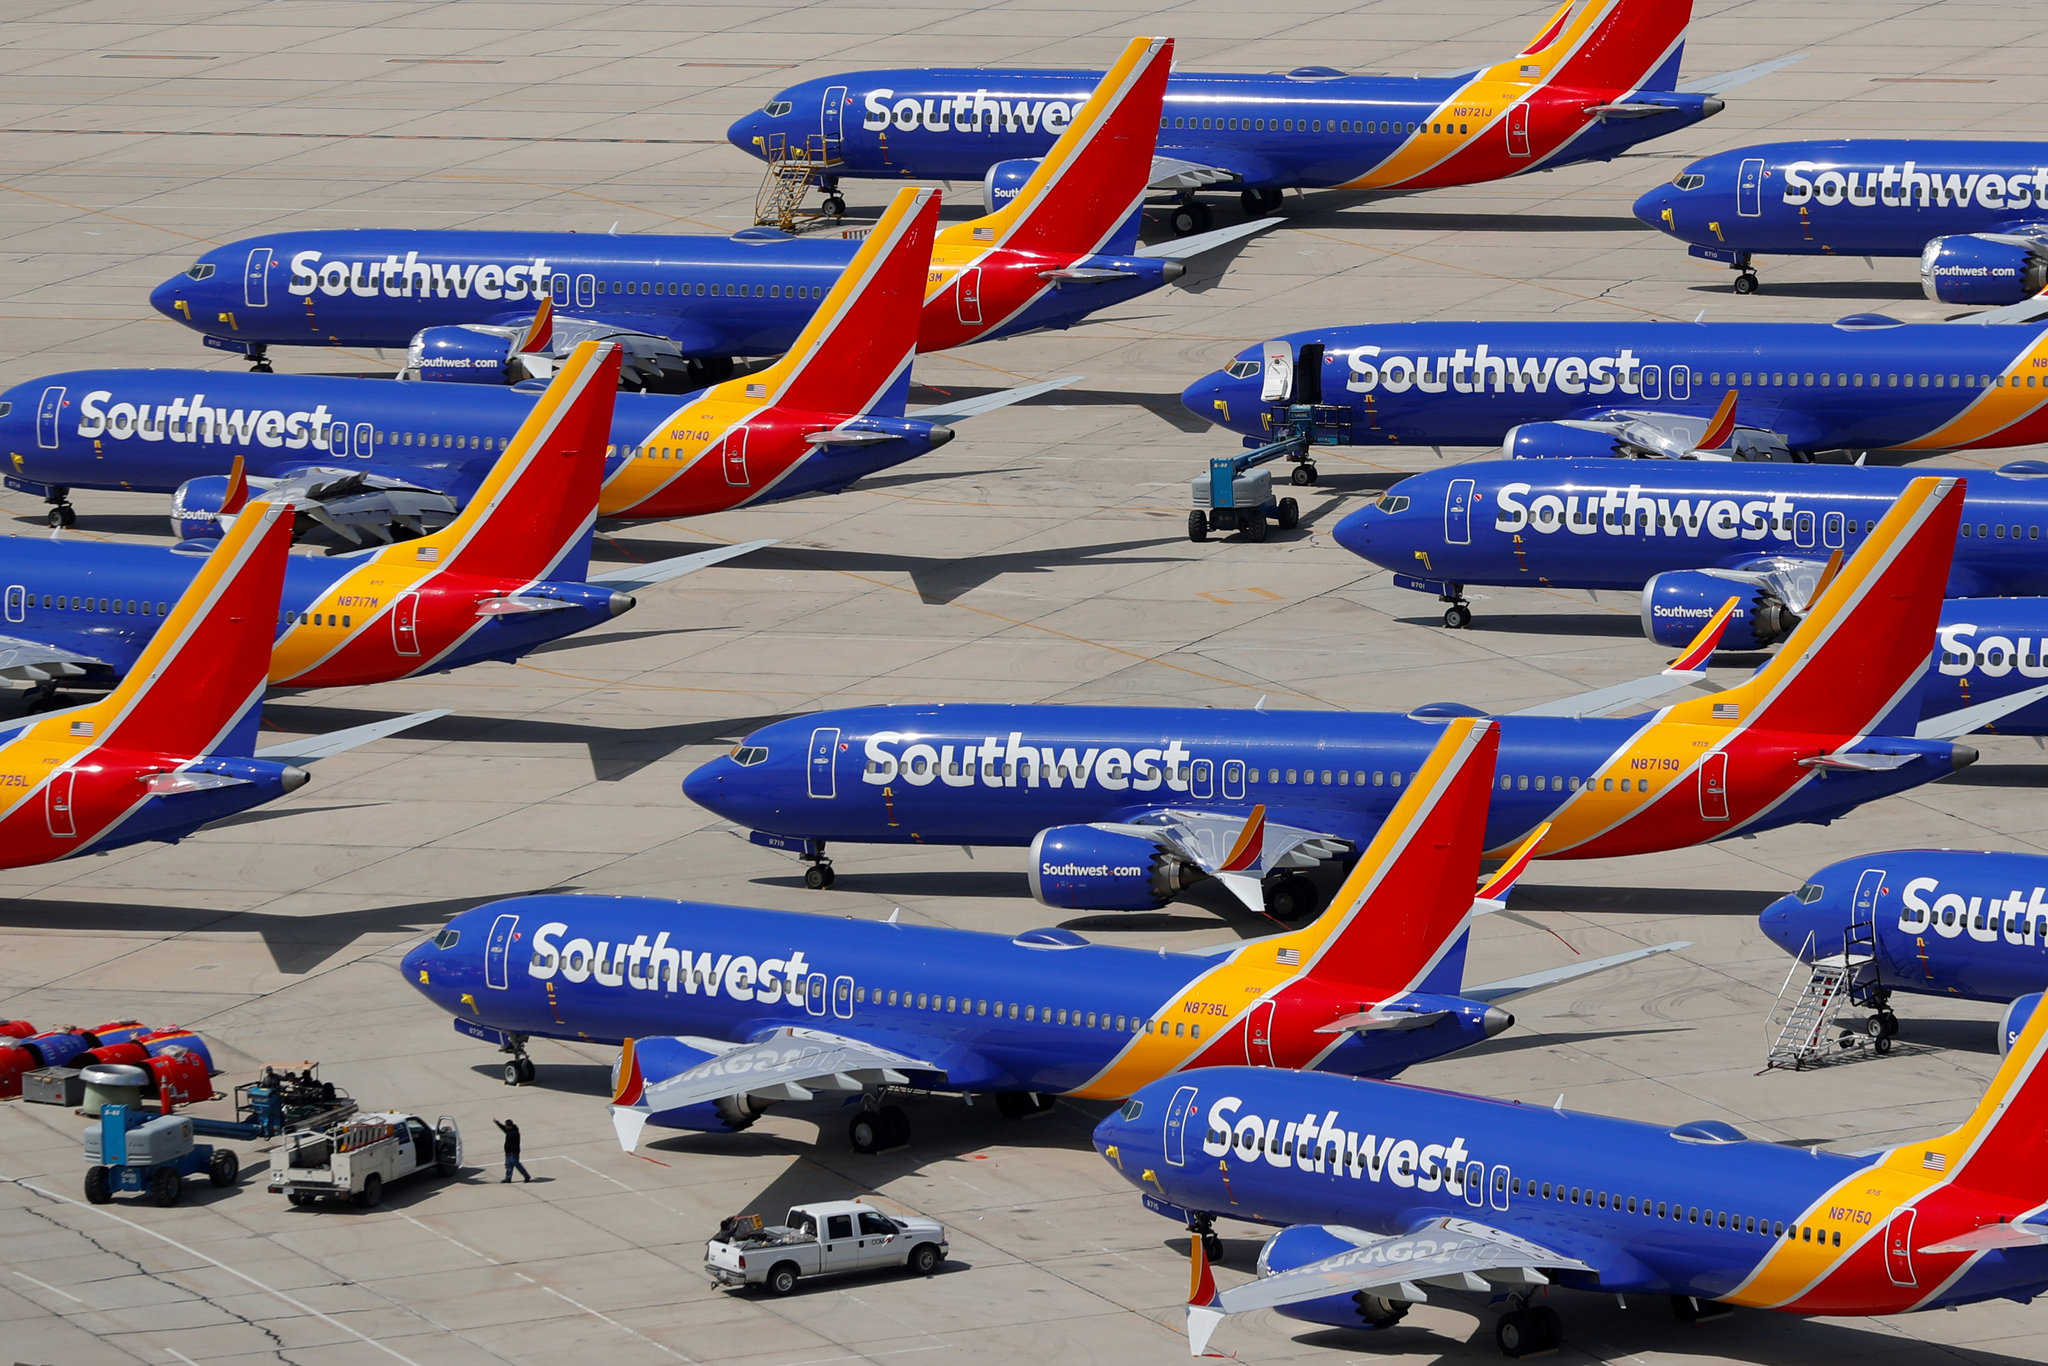
Southwest Airlines (NYSE: LUV), a major American airline known for its low-cost passenger service, recently announced its second-quarter financial results. Operating in the highly competitive airline industry, the company presented a mixed performance to investors, showcasing both positive and negative signals in its latest Q2 earnings report.
The airline reported a strong earnings per share (EPS) of $0.94, which significantly surpassed the analyst estimate of $0.51. This impressive result, a key indicator of company profitability, is supported by a more than 9% increase in its second-quarter profit from the previous year, highlighting robust financial performance.
In contrast, Southwest Airlines' quarterly revenue of $8.43 billion fell slightly short of the expected $8.58 billion. Despite this miss, the company noted it achieved record operating revenues. This performance comes even as its fuel bill rose by almost $900 million, with higher fares helping to cover these costs, a common challenge in the airline industry challenges.
Looking ahead, Southwest Airlines' guidance for the third quarter is cautious. Its adjusted earnings forecast of $0.50 to $0.75 per share is below analysts' expectations of $0.82, as highlighted by CNBC. However, the company projects stronger full-year adjusted earnings, expecting a range between $3.25 and $4.25 per share, offering a mixed investor outlook.
The company's financial health shows a Debt-to-Equity ratio of 0.44, indicating it uses less debt than equity to finance its assets. However, its current ratio of 0.49, which measures its ability to pay short-term debts, is below 1. This can suggest potential pressure on its short-term cash flow, an important consideration for stock market investors.
Market Overview
|
CTNT
Cheetah Net Supply Chain Service Inc.
|
$0.03
-1.87%
|
|
GPUS
Hyperscale Data, Inc.
|
$0.17
-6.35%
|
|
AIFF
Firefly Neuroscience, Inc.
|
$2.01
68.91%
|
|
GLND
Greenland Energy Company Common Stock
|
$5.54
3.55%
|
|
AXG
Solowin Holdings Ordinary Share
|
$0.20
-84.62%
|
|
INTC
Intel Corp.
|
$123.00
-3.45%
|
|
TSLL
Direxion Daily TSLA Bull 2X ETF
|
$9.94
-3.02%
|
|
NVDA
NVIDIA Corporation
|
$225.07
0.22%
|
|
DCX
Digital Currency X Technology Inc.
|
$0.05
-18.08%
|
|
AAL
American Airlines Group Inc.
|
$13.87
3.90%
|