Casey's General Stores (NASDAQ: CASY) Delivers Strong Q1 Earnings Beat, Highlighting Robust Financial Performance
Font: Financial Modeling Prep • Sep 08, 2026
- Casey's General Stores (NASDAQ: CASY) reported strong Q1 2026 results, surpassing analyst expectations for both earnings per share and revenue.
- The company demonstrated robust financial health with a 27.1% increase in net income year-over-year.
- Key valuation metrics, including a P/E ratio of 35.13 and a current ratio of 8.19, indicate strong financial stability and investment potential.
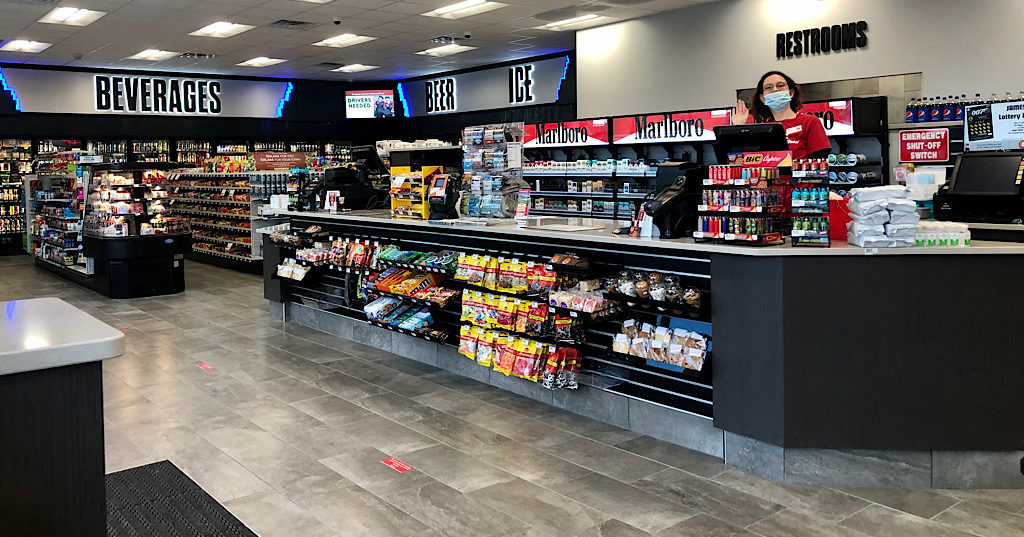
Casey's General Stores, Inc. (NASDAQ: CASY) operates a prominent convenience store chain across the Midwestern and Southern United States. The company's successful business model focuses on essential services like fuel sales, a wide array of grocery items, and a popular selection of prepared foods, notably its well-known pizza. This strategic combination of offerings makes it a crucial stop for numerous customers in its service regions, driving consistent customer traffic and revenue generation.
On September 8, 2026, Casey's General Stores announced strong quarterly results that significantly surpassed market expectations. The company reported an earnings per share (EPS) of $7.37, which was notably higher than the consensus analyst estimate of $6.78. This key metric, EPS, serves as a vital measure of a company's profit allocated to each outstanding share of stock, directly indicating its overall profitability and financial health.
In addition to the impressive earnings beat, Casey's General Stores' quarterly revenue also exceeded forecasts. The company reported a robust revenue of $5.68 billion, comfortably surpassing the estimated $5.56 billion. This strong financial performance reflects a significant increase in its financial results for the first quarter, which concluded on July 31, 2026, as highlighted by Businesswire, underscoring the company's effective growth strategies.
The strong earnings report is further supported by substantial year-over-year growth. Net income, representing the company's total profit, rose a significant 27.1% to $273.70 million. This positive financial trend is consistent with Casey's General Stores' recent history. As noted by Zacks Equity Research, the company has a strong track record of consistently surpassing earnings expectations, with an impressive average surprise of 23% over the last two quarters, demonstrating reliable financial performance.
From a comprehensive valuation standpoint, Casey's General Stores exhibits compelling metrics. The company has a price-to-earnings (P/E) ratio of 35.13, which is a key indicator comparing its stock price to its earnings per share. Furthermore, the company demonstrates a healthy current ratio of 8.19. This crucial liquidity ratio measures a company's ability to meet its short-term obligations, with a higher number strongly suggesting robust financial stability and operational efficiency, making it an attractive prospect for investment analysis.
Market Overview
|
PDSB
PDS Biotechnology Corporation
|
$0.30
36.36%
|
|
GCDT
Green Circle Decarbonize Technology Ltd.
|
$0.93
149.91%
|
|
INTC
Intel Corp.
|
$104.47
9.05%
|
|
MOBX
Mobix Labs, Inc.
|
$1.27
36.54%
|
|
ATAI
Atai Beckley Inc.
|
$7.28
-1.49%
|
|
NVDA
NVIDIA Corporation
|
$225.73
-2.01%
|
|
NOK
Nokia Oyj
|
$10.66
6.28%
|
|
ARBE
Arbe Robotics Ltd.
|
$0.74
16.93%
|
|
GPRO
GoPro, Inc.
|
$1.46
-14.41%
|
|
SPCX
Space Exploration Technologies Corp.
|
$153.47
3.73%
|