Interactive Brokers Group Inc. (NASDAQ: IBKR) Delivers Strong Q2 Financial Results Amidst Robust Client Growth
Font: Financial Modeling Prep • Jul 21, 2026
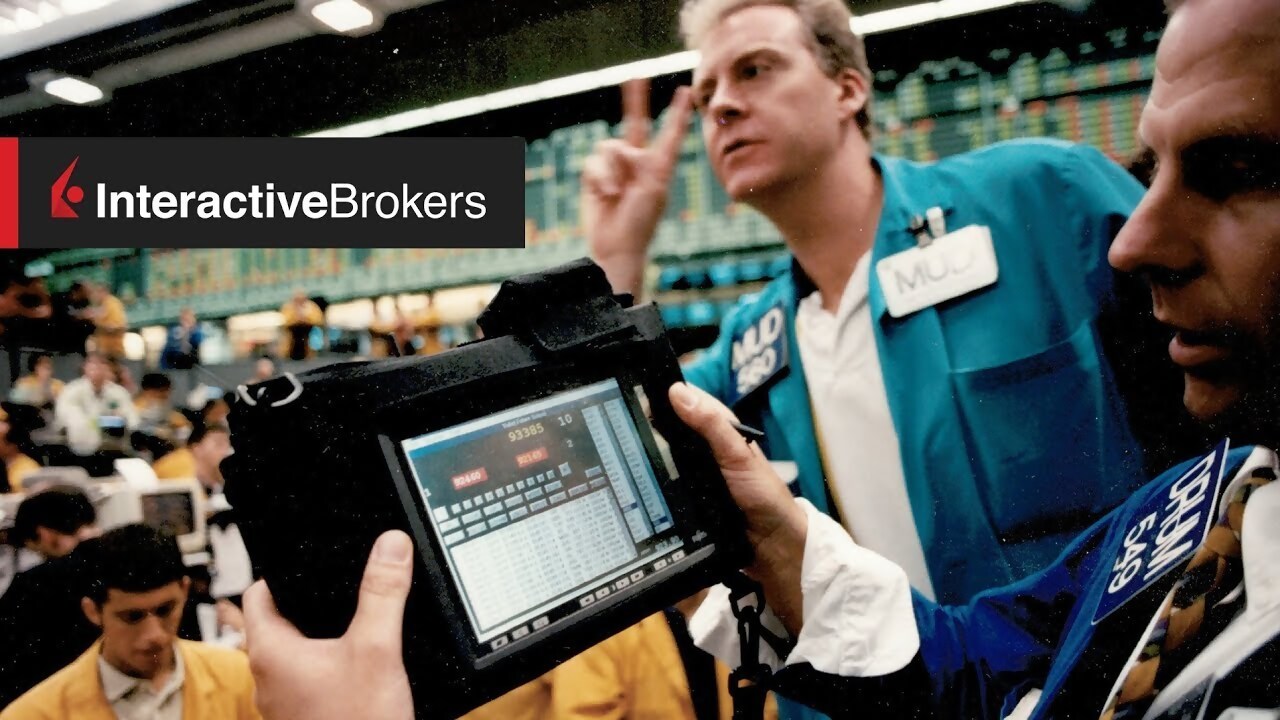
- Strong Q2 Performance: Interactive Brokers reported diluted EPS of $0.69 and net revenues of $1.90 billion, both surpassing analyst estimates.
- Significant Client Expansion: Client accounts increased by 34% year-over-year, with client equity growing by 40%, highlighting strong platform engagement.
- Solid Financial Health: The company maintains a very low Debt-to-Equity ratio of approximately 0.0006, indicating minimal reliance on debt for its operations.
Interactive Brokers Group Inc. (NASDAQ: IBKR) is an automated leading global brokerage firm established in 1978. The company provides comprehensive trading services to a diverse global client base, with over 80% of its customers located outside the United States. By the end of 2025, Interactive Brokers managed nearly $780 billion in customer equity.
On July 21, 2026, Interactive Brokers announced its second-quarter financial results. The company posted a diluted earnings per share (EPS) of $0.69. This figure successfully surpassed the consensus analyst estimate of $0.64. EPS is a key profitability metric, showing how much profit a company makes for each share of its stock.
For the same quarter, the company reported net revenues of $1.90 billion, which also beat analyst expectations of $1.75 billion. This strong financial performance was driven by several positive factors. As highlighted by Zacks Investment Research, increased client activity and a rise in customer accounts contributed significantly to the robust revenue growth figures.
Key metrics show substantial client growth leading into the results. Client accounts increased by 34% year-over-year, while client equity grew by 40%. Furthermore, Daily Average Revenue Trades (DARTs), a measure of trading frequency on its platform, surged by an impressive 53% compared to the same period in the previous year.
Interactive Brokers maintains a very low Debt-to-Equity ratio of approximately 0.0006, which indicates that the company relies very little on debt to finance its operations. The company's Price-to-Earnings (P/E) ratio stands at 37.32. This key valuation metric suggests investors are willing to pay $37.32 for every one dollar of the company's annual earnings.
Market Overview
|
OLB
The OLB Group, Inc.
|
$0.41
117.85%
|
|
FRGT
Freight Technologies, Inc.
|
$0.32
31.43%
|
|
ARAI
Arrive AI Inc.
|
$0.20
-3.08%
|
|
AXG
Solowin Holdings Ordinary Share
|
$0.11
6.67%
|
|
XHLD
TEN Holdings, Inc. Common Stock
|
$0.62
51.58%
|
|
MOBX
Mobix Labs, Inc.
|
$1.12
72.28%
|
|
SPCX
Space Exploration Technologies Corp.
|
$171.92
0.49%
|
|
INTC
Intel Corp.
|
$112.50
-3.18%
|
|
NVDA
NVIDIA Corporation
|
$239.24
0.14%
|
|
OLOX
Olenox Industries Inc
|
$1.25
42.05%
|