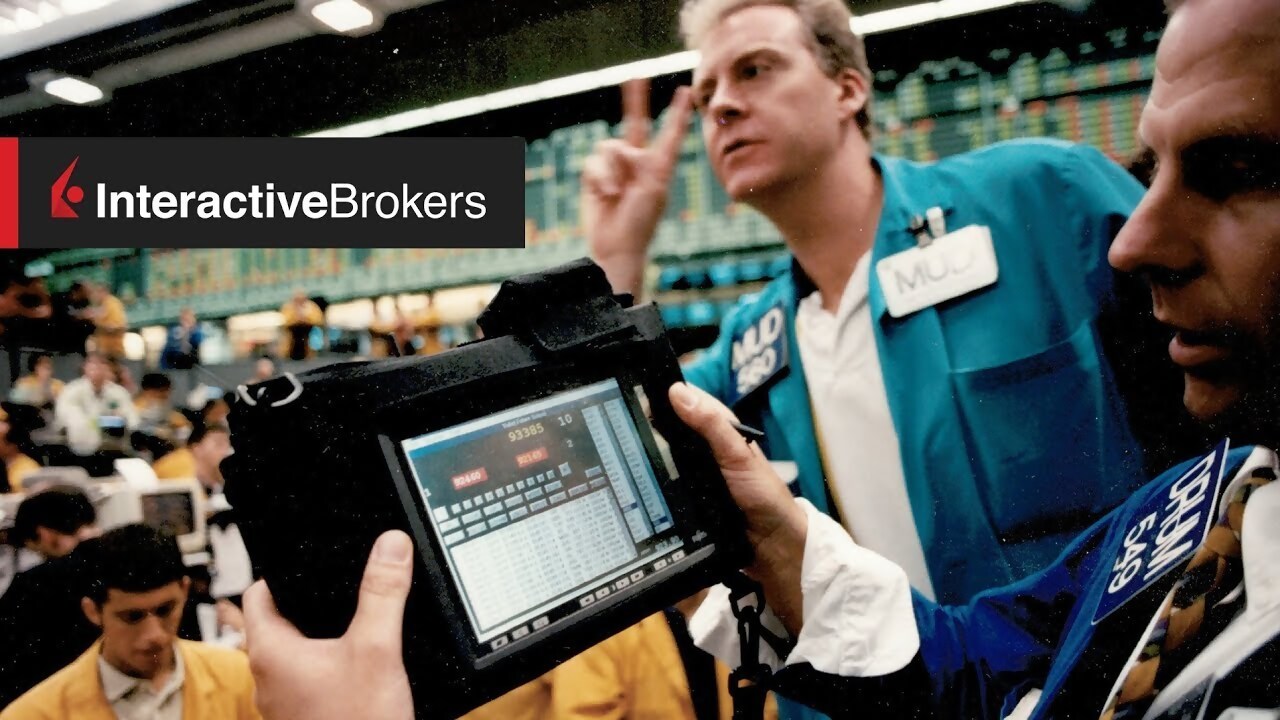
Interactive Brokers (NASDAQ:IBKR) Demonstrates Robust Growth Despite Analyst Adjustments
Font: Financial Modeling Prep • Sep 02, 2026

- Despite mixed analyst ratings, including a price target reduction from Goldman Sachs and a downgrade from UBS, Interactive Brokers (NASDAQ:IBKR) continues to show strong market confidence with a potential upside of 25% from its trading price at the time of the Goldman Sachs announcement.
- The company reported significant client growth in August 2026, with client accounts increasing 35% year-over-year to 5.460 million and client equity also rising 35% to $962.80 billion.
- Trading activity remains robust, highlighted by a 23% increase in Daily Average Revenue Trades (DARTs) to 4.276 million and a 41% surge in client margin loan balances to $101.50 billion, indicating heightened client engagement.
Interactive Brokers is an electronic brokerage firm that provides a trading platform for a wide range of financial products. The company serves both individual and institutional investors globally. A UBS analyst describes Interactive Brokers as a "best-in-class broker with a compelling growth runway," which highlights its strong position in the market.
On September 1, 2026, an analyst from Goldman Sachs lowered their price target for Interactive Brokers to $113.00 from $114.00. At the time, the stock was trading at $90.39. This revised target still suggests a potential upside of about 25% from its price on the day of the announcement, indicating continued confidence.
This news follows a separate analysis from UBS, which downgraded Interactive Brokers from a buy to a neutral rating. As highlighted by The Motley Fool, this downgrade caused the stock to fall by as much as 6.3%. Despite the rating change, the UBS analyst increased their price target to $102.00 from $50.00.
The positive long-term outlook is supported by the company's recent performance. In August 2026, Interactive Brokers reported a 35% year-over-year increase in client accounts, reaching a total of 5.460 million. Client equity, the total value of cash and securities in client accounts, also grew 35% to $962.80 billion.
Trading activity also shows strong growth. Daily Average Revenue Trades (DARTs) were 4.276 million, a 23% increase from the previous year. Additionally, client margin loan balances, which is money clients borrow to invest, rose 41% year-over-year to $101.50 billion, showing increased client engagement on the platform.
Market Overview
|
OLB
The OLB Group, Inc.
|
$0.41
117.85%
|
|
FRGT
Freight Technologies, Inc.
|
$0.32
31.43%
|
|
ARAI
Arrive AI Inc.
|
$0.20
-3.08%
|
|
AXG
Solowin Holdings Ordinary Share
|
$0.11
6.67%
|
|
XHLD
TEN Holdings, Inc. Common Stock
|
$0.62
51.58%
|
|
MOBX
Mobix Labs, Inc.
|
$1.12
72.28%
|
|
SPCX
Space Exploration Technologies Corp.
|
$171.92
0.49%
|
|
INTC
Intel Corp.
|
$112.50
-3.18%
|
|
NVDA
NVIDIA Corporation
|
$239.24
0.14%
|
|
OLOX
Olenox Industries Inc
|
$1.25
42.05%
|